New Pivot View
Undb Wed Nov 13 2024
Introducing Pivot View: Unlock Powerful Data Insights with Ease
In today’s data-driven world, simply storing data isn’t enough—you need to be able to transform it into actionable insights. This is where Pivot View comes in, offering a versatile way to analyze, summarize, and visualize your data from multiple perspectives. We’re excited to introduce this feature, designed to empower you to extract meaning from your data and make informed decisions quickly.

What Is Pivot View?
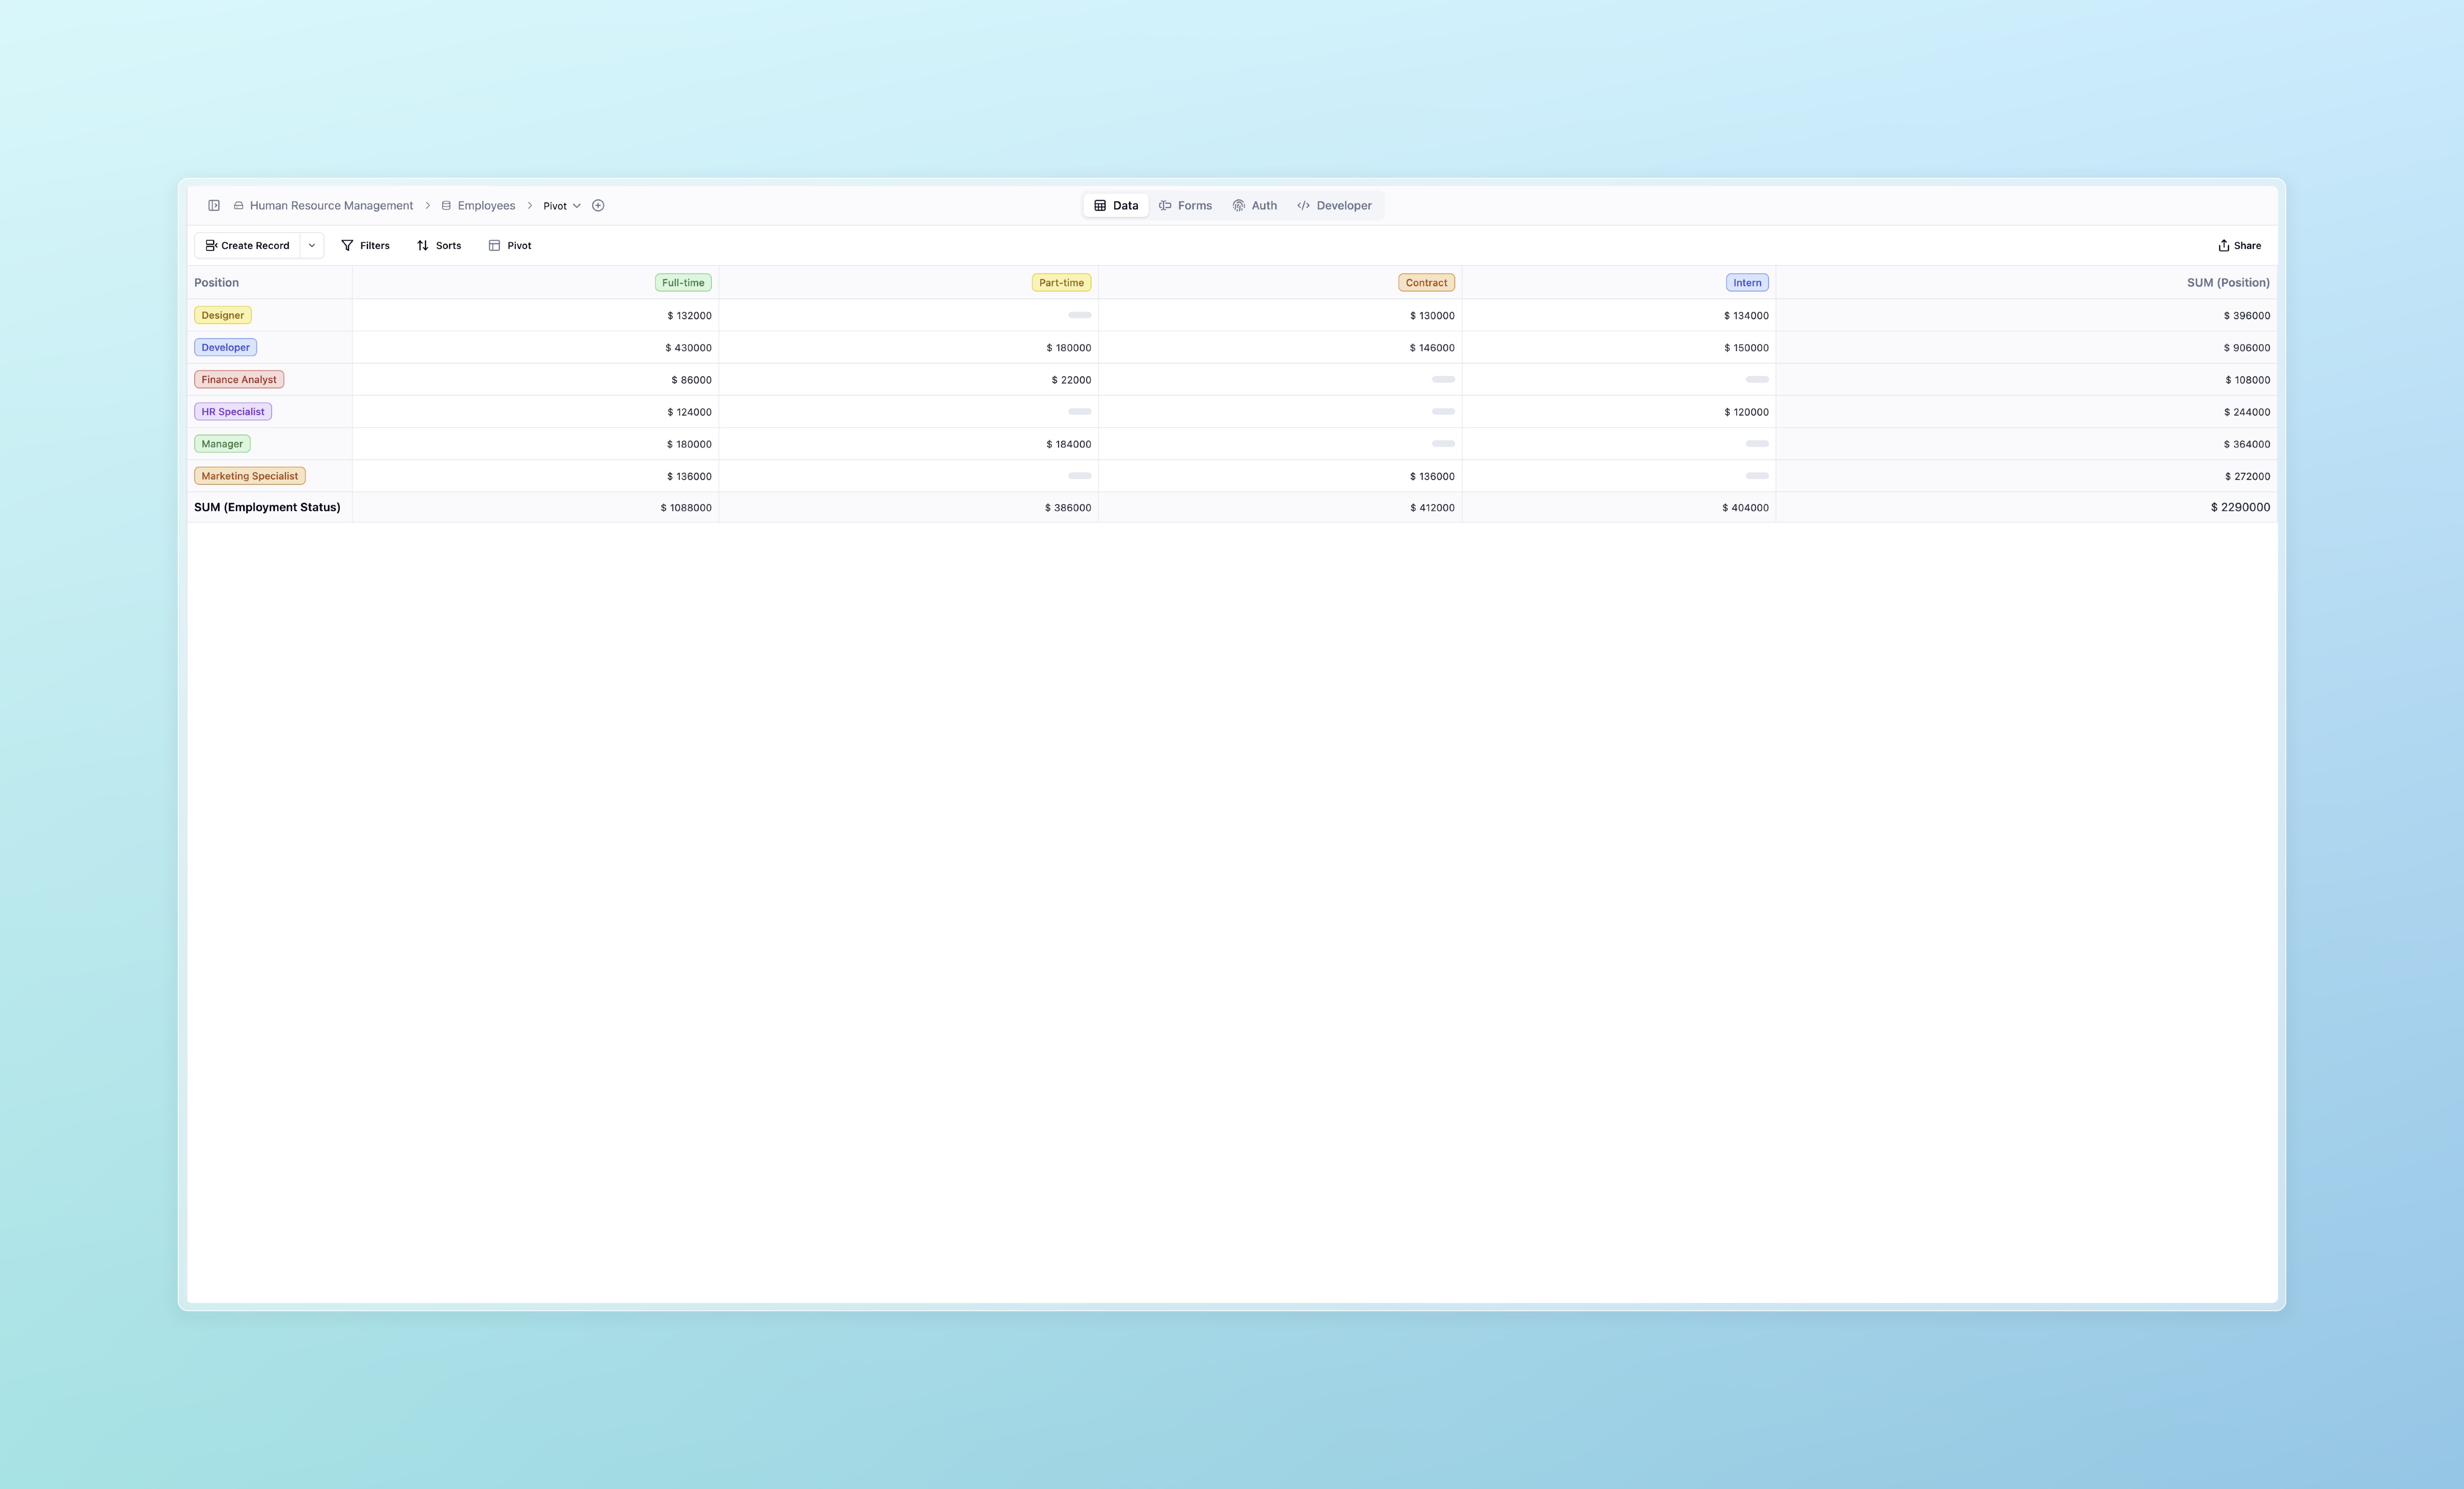
Pivot View is a flexible, interactive tool that allows you to view and aggregate data across multiple dimensions by configuring rows, columns, and values. Think of it as a customizable summary table where you can see all the key information in one place. Whether you’re monitoring project metrics, tracking financial performance, or analyzing customer demographics, Pivot View provides a way to create dynamic reports tailored to your specific needs.
Why Pivot View?
Here are a few reasons why Pivot View can be a game-changer for your workflow:
- Quick Analysis: Easily group and calculate data across various categories, such as summing sales by region or counting tasks by team.
- Flexible Aggregation: Customize how data is summarized with options for sum, count, average, maximum, or minimum values.
- Real-Time Reporting: Make informed decisions on the fly by setting up views that auto-update as new data comes in.
- User-Friendly Configuration: With an intuitive setup process, you can define row and column labels, select values, and apply aggregations—all without needing complex formulas or technical skills.
Use Cases
Wondering how Pivot View might fit into your daily operations? Here are a few common scenarios:
1. Financial Analysis
If you’re managing budgets or tracking sales, Pivot View can help you summarize revenue, expenses, or profits by different categories like department, product, or region. For instance, create a Pivot View that shows total sales per product category to instantly see top performers.
2. Project Management
Track and manage task distributions across teams or projects. Use Pivot View to count tasks per project, measure team workloads, or calculate average task completion times for insight into team efficiency.
3. Customer Demographics
For marketing and sales teams, Pivot View provides a way to analyze customer segments. View customer counts by demographics (e.g., age, location) or purchasing behavior (e.g., frequency, total spend) to refine targeting strategies.
How to Get Started with Pivot View
Ready to try it out? Here’s a quick guide to setting up your first Pivot View:
- Select the Pivot View Option: Go to your table and select Pivot View from the view options. This creates a blank view ready for configuration.
- Define Your Rows and Columns: Choose fields for the Row Label and Column Label to set up how data will be grouped. For instance, you might use “Team” as a Row Label and “Task Status” as a Column Label to track team progress.
- Choose Your Value and Aggregation: Select a Value field and apply an aggregation type (e.g., Sum, Count, Average). For example, to track total hours worked, select a numeric field and set the aggregation to Sum.
- Save and Analyze: Save the configuration and view your data summarized in the Pivot View. Use it to explore your data from different angles, and update the configuration anytime to adapt to changing needs.
Pro Tips for Maximizing Pivot View
- Experiment with Aggregation Types: Try different aggregation types to see data trends from new perspectives. For example, using Count can show frequency distributions, while Max or Min might highlight performance peaks.
- Filter for Clarity: Apply filters to focus on specific groups or ranges, making your data more digestible.
- Customize Row and Column Labels: Use single-choice fields as labels for better categorization and readability.
The Future of Pivot View
We’re committed to making Pivot View an essential tool for data analysis, and there’s more to come. Future updates will include additional features to further enhance data filtering, visualization, and sharing capabilities.
Pivot View is available now, and we encourage you to dive in and start experimenting! We can’t wait to see the insights you uncover and the impact this feature will have on your data-driven decisions.
Let us know what you think, and stay tuned for more updates!
Learn More
Check out the Pivot View documentation for more details and examples on how to use this new feature.