Undb 1.0.0-100: View Widgets Feature
Undb Fri Oct 11 2024
Empower Your Data Insights with New undb View Widgets
We’re excited to announce a new feature in undb that brings even more power to your data views—introducing View Widgets! Widgets are a great way to visualize key statistics about your data, enabling you to quickly grasp essential insights without needing to manually calculate or filter through records. Let’s dive into how this feature can help you make the most of your data.

What Are View Widgets?
View Widgets in undb are visual tools that allow you to display aggregated data directly within your view. They make it easy to get an at-a-glance understanding of your dataset without having to perform manual analysis. Each widget can help you track specific statistics, making it easier to monitor metrics that matter to you.
Types of Available Widgets
We currently offer several types of widgets that cater to different kinds of data analysis:
- Count: This widget gives you the total number of records in your view. It’s perfect for quickly checking how many customers you have, how many orders are pending, or how many tasks are on your to-do list.
- Sum: The Sum widget allows you to calculate the sum of a specific numeric field. This is especially useful for metrics like the total revenue from sales or the total hours logged by your team.
- Average (Avg): The Average widget helps you determine the mean value of a numeric field, which can be handy for analyzing average ratings, average spend per customer, or average order sizes.
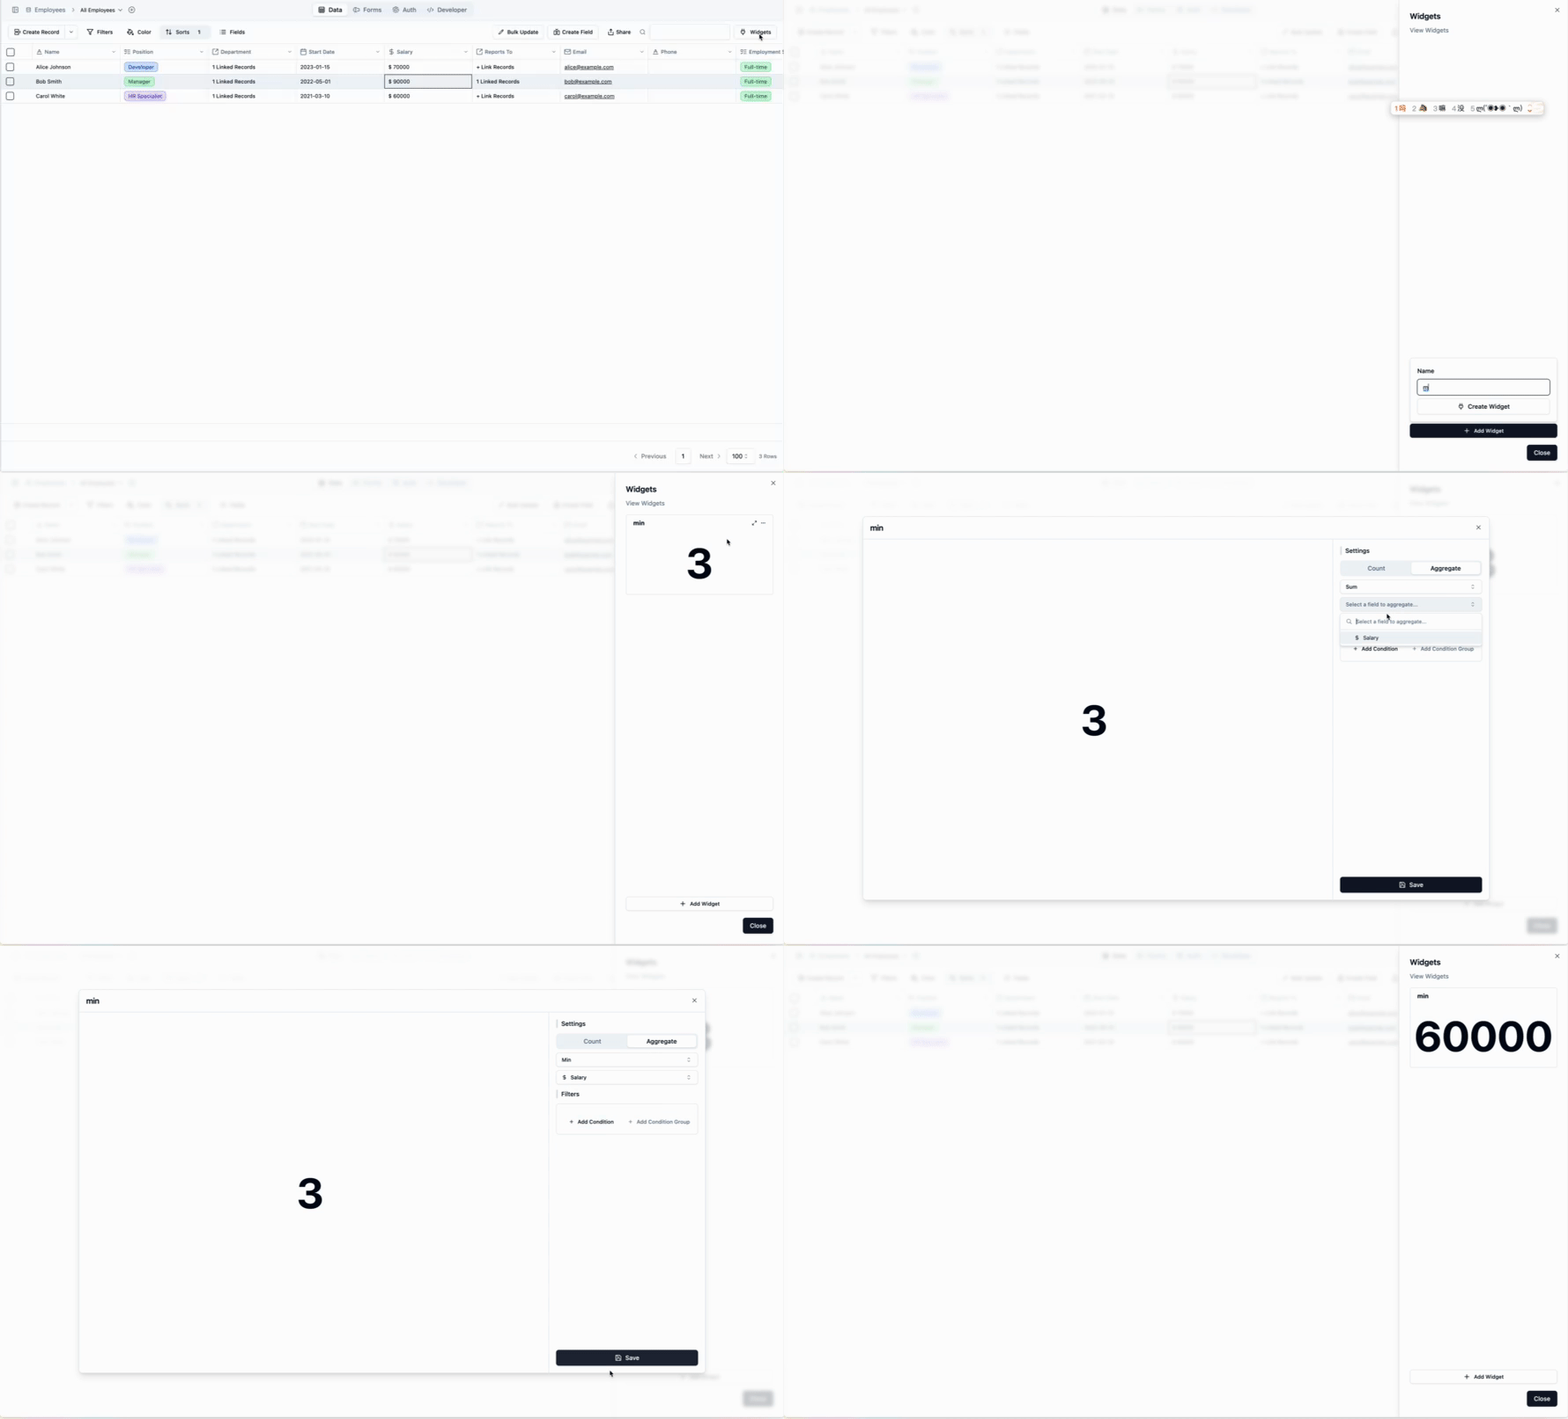
- Minimum (Min): Use the Min widget to find the smallest value in a numeric field. This can be useful when tracking the lowest stock level or the minimum score in a performance evaluation.
- Maximum (Max): The Max widget shows you the highest value in a numeric field, such as the largest order value or the highest rating received.
Note: Except for the Count widget, other widget types require a numeric field to function.
How to Create a Widget
Adding a widget to your view is simple:
- Open or Create a View: Go to the view where you want to add a widget.
- Click the Add Widget Button: You’ll find the “Add Widget” button right on the view page.
- Select the Statistic Type: Choose from Count, Sum, Average, Min, or Max, and configure it based on the data field you want to analyze.
In just a few clicks, you can have meaningful statistics available right in your view, ready to give you insights at a glance.
Use Cases for Widgets
Widgets are versatile tools that fit a variety of use cases:
- Sales and Revenue Tracking: Use the Sum widget to see total sales figures, and the Average widget to get insights into average customer spending.
- Task Management: Keep track of the number of active tasks with the Count widget, or monitor completion times using Min and Max widgets.
- Inventory Monitoring: Quickly find out the lowest stock levels using the Min widget, or monitor product quantities using Count.
Benefits of View Widgets
By incorporating widgets into your views, you can:
- Save Time: Instantly access key metrics without needing to manually filter or calculate data.
- Make Better Decisions: Having critical insights at your fingertips helps you make informed, data-driven decisions.
- Improve Data Visibility: Widgets provide a snapshot of your data, making it easy for you and your team to stay on top of what matters most.
Get Started Today!
Ready to bring more insights into your workspace? Start using View Widgets in undb today and transform the way you interact with your data. Whether you are managing projects, tracking sales, or monitoring inventory, widgets can help you get a clearer, quicker understanding of your data.
Stay tuned for more updates as we continue to make undb an even more powerful tool for your data management needs!